Intro to data structure (by way of a calming Spring scene)
I’m going to explain proper data structure — following the tidy data principles — using a calming Spring scene because that’s all our brains can handle right now.
The Spring Scene
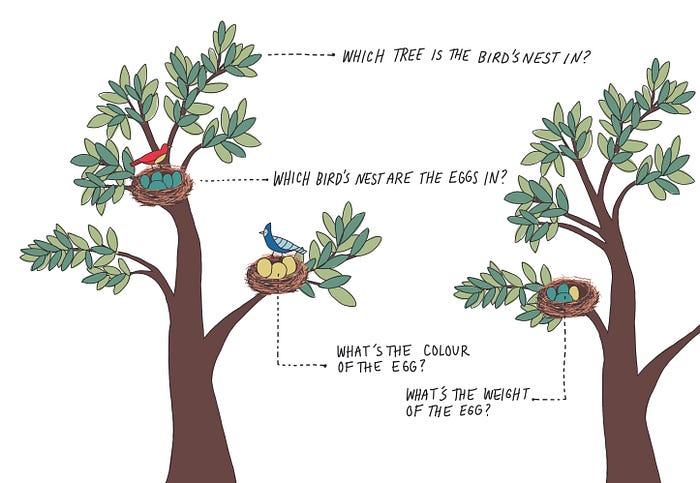
A Red Bird laid five eggs in a tree. Her friend, the Blue Bird, laid three eggs in the same tree. The Red Bird also laid four eggs in the tree next door (it was a busy Spring!). Each egg varied in colour and weight.

Fiona, the Birdwatcher wanted to record these observations in her notebook. She intended to analyze the data later on, so she didn’t want to miss any detail.

Each time Fiona tried to capture the data, she was missing some information or it wasn’t quite right. Fiona was stumped. How could she structure the dataset in a way that reflected everything she saw?
Structuring data for success
The only time I’m a neat-freak is when it comes to data. But I’ve always had trouble explaining the necessity (and euphoria) of organized data until I heard of the concept of Tidy Data. In his 2014 paper, Hadley Wickham clearly and brilliantly explains the key principles of standardizing data structure.
If we work together (or we’re just general acquaintances), I’ve likely sent you this paper. I also know you haven’t read it because it’s 23 pages long. So, I’m going to relate Wickham’s principles back to the Spring Scene to show you how important — and satisfying — tidy data is.
The basics
Let’s first refresh your memory on the key components of a dataset, since most probably haven’t thought about it since grade school (or ever).

A dataset is a table of collected information on one topic
- A dataset is made up of rows and columns
- Rows and columns intersect at a value
- A value belongs to an observation (row) and a variable (column):
- An observation is the unit you’re collecting data on
- Variables are the different ways you can describe the attributes of that unit - A variable can be numerical (#) or categorical (text aka a string) but each variable can only contain values measuring the same thing.
Tidy Data Principles*
Each variable forms a column
Each observation forms a row
Each cell is a single value
These principles aren’t ground-breaking, they’re logical. They give people a framework to properly structure data, when most people didn’t know properly structured data was even a thing.
Tidying up Fiona’s data
To help Fiona apply the Tidy Data principles, we need to identify all possible data points in the Spring scene. What’s the key thing Fiona was observing and all the ways she could record information on it?
Each point has something in common. We’re describing different attributes of eggs. This means each egg is an observation (rows) and tree, bird’s nest, colour and weight are variables (columns).
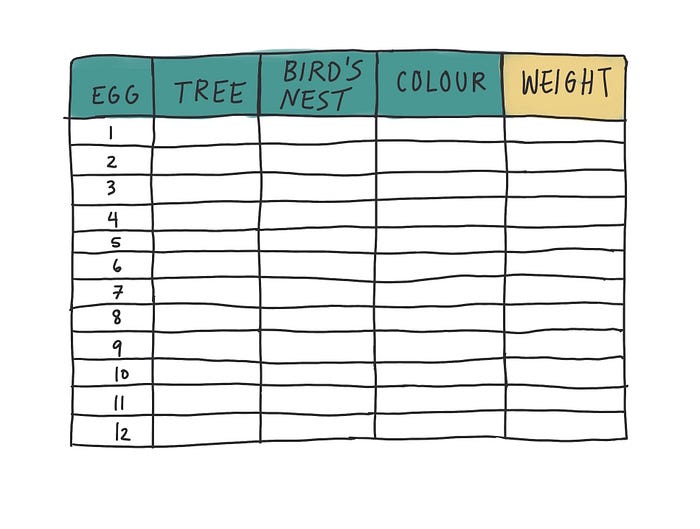
Weight is highlighted because it’s the only numerical variable. Even though Egg is a number, it’s still considered categorical because it’s a unique identifier of the data we’re collecting. For example, you can’t multiply Egg 1 by Egg 2.
Now, let’s determine the values for each variable.
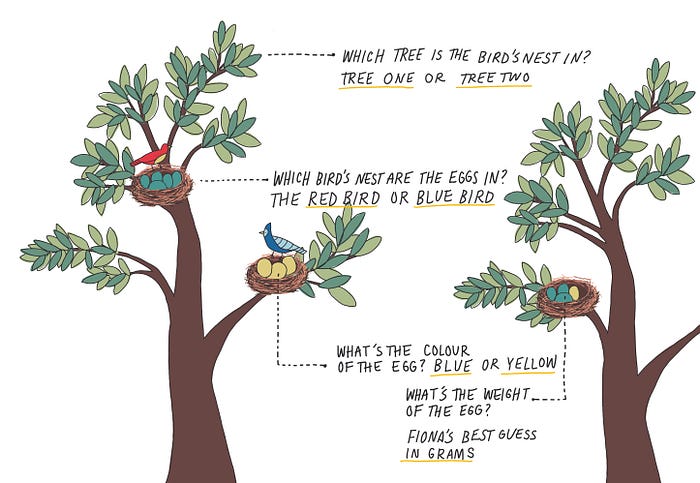
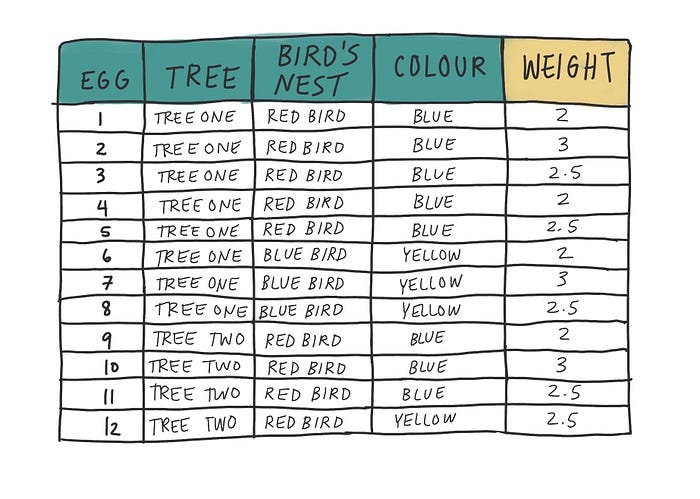
Once Fiona has uncovered the possible values within each variable, she is ready to collect her data.
Fiona’s messy data
Tidy data is not the only way to record and store data. Fiona’s initial attempts weren’t wrong because there’s technically no wrong way to record data.
But her data was messy and in most cases, incomplete. So, I took the red marker to Fiona’s notebook to identify where she made a mess.
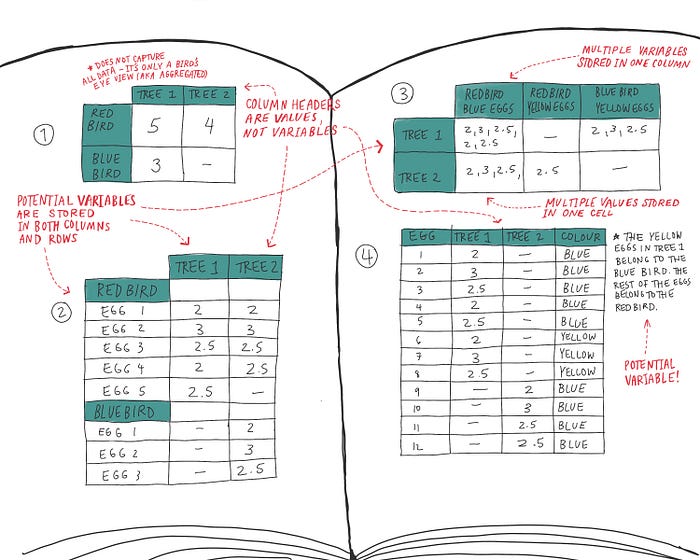
Her key mistakes according to Tidy Data principles were:
- Column headers are values, not variable names
- Multiple variables are stored in one column
- Variables are stored in both rows and columns
Why is tidy data important?
The more organised you are, the more efficient you are. The same goes for data.
Tidy Datasets are simply easy to manipulate, model and visualize. No matter the initial format, you’ll likely need to convert data to a tidy format in order to work with it efficiently.
The majority of any data project is cleaning and preparation — 80% according to most estimations, which I totally agree with. Data analysts waste countless hours getting datasets in order. Having a standardized approach makes initial data cleaning easier because you don’t have to start from scratch every time.
Properly structured data is essential when it comes to data visualisation — especially data visualisation tools. You can’t expect a nice, clean visualisation to come out of every single way data can be structured (i.e. Fiona’s multiple messy datasets). Tools only understand data formatted in a certain way.
Tidy data also supports collecting disaggregated data. Being well-versed in proper data collection and structure allows us to be more aware of all the potential data that needs to be captured but more importantly, critical detail left out of a dataset.
Like most things in life, you get out what you put in. So I hope next time you’re working with data, I’ve inspired you to clean up your act!
More illustrated introductions to the wonderful word of data:
- Most People Like Fruit: the importance of data disaggregation.
- The Fun of the Run (and data Visualization)
*Tidy data principles were listed in accordance with 2017 update.
